Note
Go to the end to download the full example code.
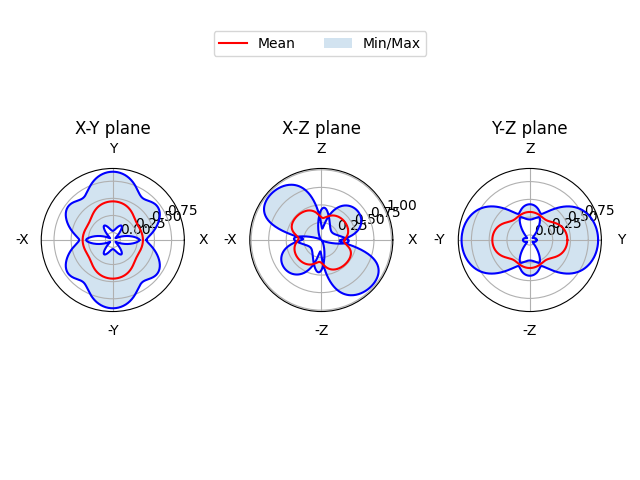
Plot Poisson ratio as 2D sections
This example shows how to plot the directional dependence of the Poisson ratio in XY, XZ and YZ planes.
Define the stiffness tensor for NiTi
We define the stiffness tensor for a monoclinic NiTi material using its elastic constants. They are taken from the Materials Project (mp-1048).
from elasticipy.tensors.elasticity import StiffnessTensor
C = StiffnessTensor.monoclinic(
    phase_name='TiNi',
    C11=231, C12=127, C13=104,
    C22=240, C23=131, C33=175,
    C44=81, C55=11, C66=85,
    C15=-18, C25=1, C35=-3, C46=3
)
print("Stiffness tensor for NiTi:\n", C)
Stiffness tensor for NiTi:
 Stiffness tensor (in Voigt mapping):
[[231. 127. 104.   0. -18.   0.]
 [127. 240. 131.   0.   1.   0.]
 [104. 131. 175.   0.  -3.   0.]
 [  0.   0.   0.  81.   0.   3.]
 [-18.   1.  -3.   0.  11.   0.]
 [  0.   0.   0.   3.   0.  85.]]
Phase: TiNi
Get the Poisson ratio from the stiffness tensor
nu = C.Poisson_ratio
print("Poisson ratio:")
print(nu)
Poisson ratio:
Hyperspherical function
Min=-0.550188605619326, Max=1.4394343811864985
Plot it as polar curves in planar sections
fig, ax = nu.plot_xyz_sections()
Total running time of the script: (0 minutes 0.822 seconds)