Note
Go to the end to download the full example code.
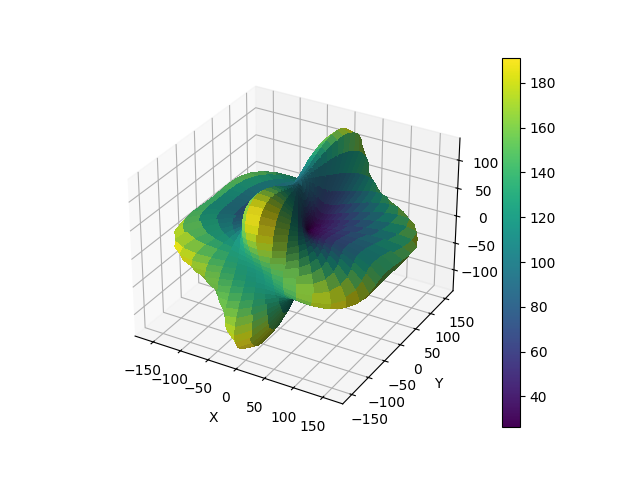
Plot Young modulus as a 3D surface
This example shows how to plot the directional dependence of the Young modulus as a 3D surface.
Define the stiffness tensor for NiTi
We define the stiffness tensor for a monoclinic NiTi material using its elastic constants. They are taken from the Materials Project (mp-1048).
from elasticipy.tensors.elasticity import StiffnessTensor
C = StiffnessTensor.monoclinic(
    phase_name='TiNi',
    C11=231, C12=127, C13=104,
    C22=240, C23=131, C33=175,
    C44=81, C55=11, C66=85,
    C15=-18, C25=1, C35=-3, C46=3
)
print(C)
Stiffness tensor (in Voigt mapping):
[[231. 127. 104.   0. -18.   0.]
 [127. 240. 131.   0.   1.   0.]
 [104. 131. 175.   0.  -3.   0.]
 [  0.   0.   0.  81.   0.   3.]
 [-18.   1.  -3.   0.  11.   0.]
 [  0.   0.   0.   3.   0.  85.]]
Phase: TiNi
Get the Young modulus from the stiffness tensor
E = C.Young_modulus
print("Young's modulus:")
print(E)
Young's modulus:
Spherical function
Min=26.28357770763925, Max=191.396591469876
Plot it as a 3D surface
E.plot3D()
Use Matplotlib instead of Plotly
By default, elasticipy uses Plotly to render the surface, allowing interactive plot (see above). Matplolib can be used instead:
E.plot3D(backend='matplotlib')
<Axes3D: xlabel='X', ylabel='Y', zlabel='Z'>
Total running time of the script: (0 minutes 0.440 seconds)