Note
Go to the end to download the full example code.
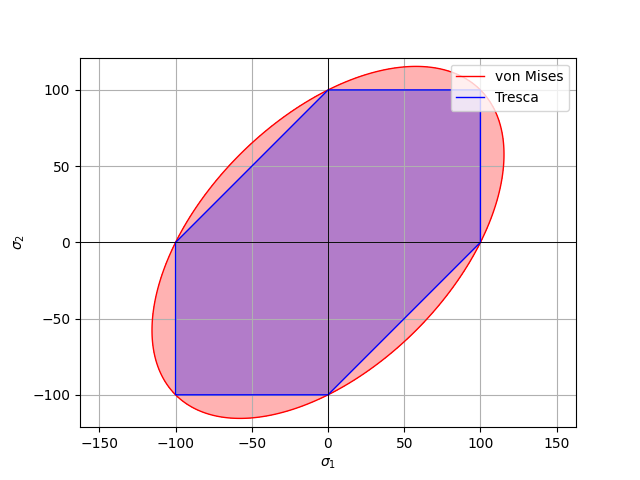
Plot the Tresca hexagon and the von Mises ellipse
We plot the elastic domain, with respect to the von Mises and Tresca criteria, on one single Matplotlib axis.
Note
This somehow replicates the figure shown on wikipedia to illustrate the difference between those criteria (see here).
from elasticipy.yield_criteria import VonMisesCriterion, TrescaCriterion

sigma_y = 100 # yield stress
mises = VonMisesCriterion(yield_stress=sigma_y)
tresca = TrescaCriterion(yield_stress=sigma_y)
fig, ax = mises.plot2D()
fig, ax = tresca.plot2D(fig=fig, ax=ax, color='blue')
ax.legend()
fig.show()
Total running time of the script: (0 minutes 0.543 seconds)