Note
Go to the end to download the full example code.
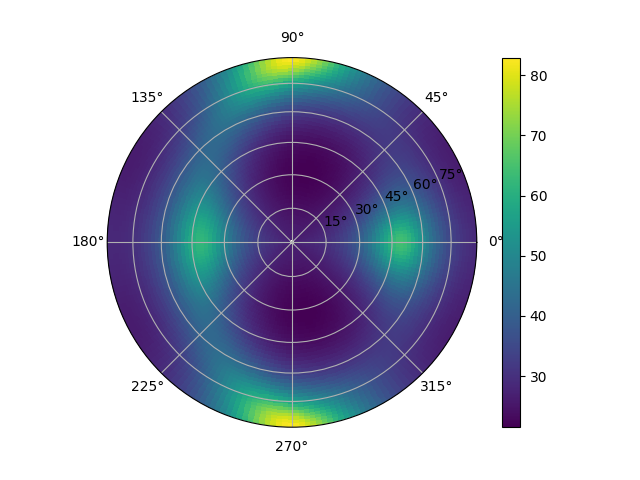
Plot shear modulus as a pole figure
This example shows how to plot the directional dependence of the shear modulus as a pole figure.
Define the stiffness tensor for NiTi
We define the stiffness tensor for a monoclinic NiTi material using its elastic constants. They are taken from the Materials Project (mp-1048).
from elasticipy.tensors.elasticity import StiffnessTensor
C = StiffnessTensor.monoclinic(
    phase_name='TiNi',
    C11=231, C12=127, C13=104,
    C22=240, C23=131, C33=175,
    C44=81, C55=11, C66=85,
    C15=-18, C25=1, C35=-3, C46=3
)
print("Stiffness tensor for NiTi:\n", C)
Stiffness tensor for NiTi:
 Stiffness tensor (in Voigt mapping):
[[231. 127. 104.   0. -18.   0.]
 [127. 240. 131.   0.   1.   0.]
 [104. 131. 175.   0.  -3.   0.]
 [  0.   0.   0.  81.   0.   3.]
 [-18.   1.  -3.   0.  11.   0.]
 [  0.   0.   0.   3.   0.  85.]]
Phase: TiNi
Get the shear modulus from the stiffness tensor
G = C.shear_modulus
print("Shear modulus:")
print(G)
Shear modulus:
Hyperspherical function
Min=8.748742560860755, Max=86.60555127546392
Plot it as a pole figure
The default projection is Lambert.
fig, ax = G.plot_as_pole_figure()
Total running time of the script: (0 minutes 0.626 seconds)